Fig. 10
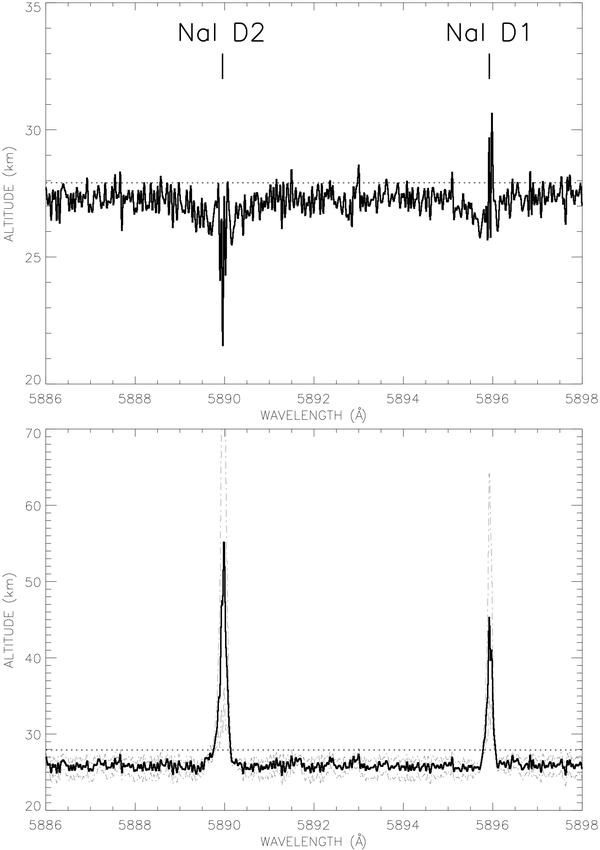
NaI doublet spectral region. The shifted h(λ) variations (solid lines) are shown along with the level of the model ozone prediction (dotted line). Upper plot: the zero level correction as detailed in Sect. 3 is not applied. The two NaI narrow atmospheric signatures do not show up while through our complete data analysis method the broad wings of the sodium solar lines are obviously still present, contrary to expectation (the solar broad lines wings should not appear in any information uniquely related to the Earth atmosphere). Lower plot: the zero level correction by subtracting a 0.0003 value is now applied (see text). The NaI solar wings have disappeared, while the narrow NaI atmospheric signatures clearly show up. To show the impact of the zero level correction, the two evaluations corresponding to the 0.0002 and 0.0004 zero corrections are overplotted (thin dash-dotted lines). This gives a direct idea of the induced error bars on our evaluation.

Current usage metrics show cumulative count of Article Views (full-text article views including HTML views, PDF and ePub downloads, according to the available data) and Abstracts Views on Vision4Press platform.
Data correspond to usage on the plateform after 2015. The current usage metrics is available 48-96 hours after online publication and is updated daily on week days.
Initial download of the metrics may take a while.