Fig. 7
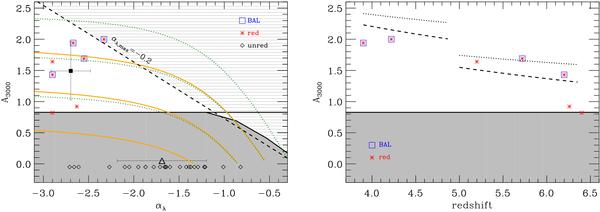
Left hand panel: red asterisks show the best fitting values of A3000 and αλ, as obtained for reddened quasars. Red asterisks surrounded by blue squares represent BAL quasars. The black filled square represents the corresponding mean value, and the error bars the standard deviations. The empty black triangle and the associated error bars denote the αλ mean value and the 1σ dispersion in the case of unreddened quasars. Solid orange and dotted green curves represent the maximum value of A3000, such that, for a given bolometric luminosity Lbol, the observed flux at a given wavelength is greater than the flux detection limit in the Z-band and I-band, respectively. The bolometric luminosity has been varied in the range 1047 < Lbol < 1048 (curves from the bottom to the top). The orizontal black solid line represents the minimum extinction required for a quasar to be classified as “dust reddened”. Quasar spectra reddened by an extinction lower than this minimum value (gray shaded area) can still be fitted with a power law redder than the intrinsic one, and classified as “unreddened”. The black dashed line shows the effect of quasar color selection criteria on our results. High-z quasars are selected to have a blue color on the filters redwards of the dropout (z−J and i−z). This requirement can be translated into a maximum observed spectral slope (αλ,max) which implies a maximum extinction A3000,max affecting quasars. Clearly A3000,max depends on the intrinsic slope αλ of the quasar, and it is shown with the black dashed line for αλ,max = −0.2, i.e. the minimum of the slope distributions in the SDSS quasar survey. Quasars reddened by an extinction higher than the dashed line (gray hatched region) are lost by the quasar color selection criteria. Right hand panel: trend of A3000 with redshift. The lines represent the maximum value of A3000 for which a reddened spectrum, for a fixed bolometric luminosity (Lbol = 1048 erg s-1), is still detectable by the SDSS. The results have been obtained assuming a slope for the intrinsic continuum αλ = −2.4 (dotted), αλ = −1.6 (dashed). The horizontal black solid line and the gray shaded region have the same meaning of the ones in the left hand panel.
Current usage metrics show cumulative count of Article Views (full-text article views including HTML views, PDF and ePub downloads, according to the available data) and Abstracts Views on Vision4Press platform.
Data correspond to usage on the plateform after 2015. The current usage metrics is available 48-96 hours after online publication and is updated daily on week days.
Initial download of the metrics may take a while.