Fig. 4
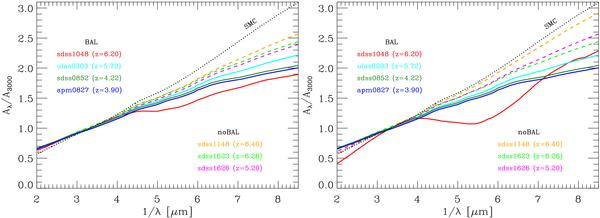
Best fit extinction curves of reddened quasars. The solid lines are for BAL quasars, while dashed lines are for non-BAL quasars. For comparison, the SMC extinction curve is also shown and labeled in the figure (dotted black line). The panel on the left shows the results assuming a minimum intrinsic slope αλ,min = −2.9, while the panel on the right is obtained with αλ,min = −2.6.
Current usage metrics show cumulative count of Article Views (full-text article views including HTML views, PDF and ePub downloads, according to the available data) and Abstracts Views on Vision4Press platform.
Data correspond to usage on the plateform after 2015. The current usage metrics is available 48-96 hours after online publication and is updated daily on week days.
Initial download of the metrics may take a while.