Fig. 5
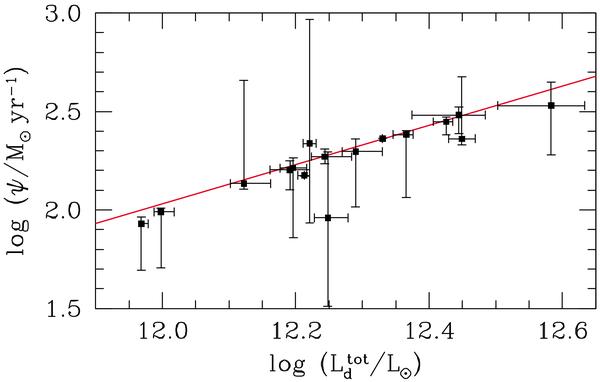
Median-likelihood estimate of the total dust luminosity plotted against star formation rate for the ULIRGs in our sample (both derived from our SED fitting). The red line shows the Kennicutt (1998) relation for optically-thick starbursts, corrected for Chabrier (2003) IMF (Eq. (6)). The error bars correspond to the 16th–84th percentile range of the likelihood distributions of each parameter.
Current usage metrics show cumulative count of Article Views (full-text article views including HTML views, PDF and ePub downloads, according to the available data) and Abstracts Views on Vision4Press platform.
Data correspond to usage on the plateform after 2015. The current usage metrics is available 48-96 hours after online publication and is updated daily on week days.
Initial download of the metrics may take a while.