Fig. 3
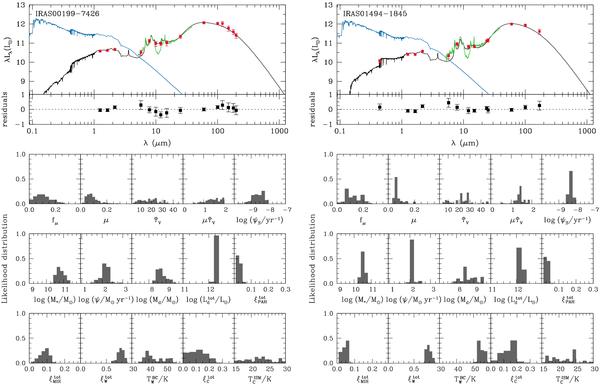
Top panels: Best-fit models of the ULIRGs in our sample
(observed-frame). The IRAS name of the galaxy is indicated in the top left-hand
corner. The blue line shows the unattenuated stellar spectrum, and the black line
shows the total SED including the attenuated stellar spectrum and the emission
from dust in the infrared. The red squares are the available observed broad-band
luminosities, and the green line is the observed Spitzer/IRS
spectrum of this galaxy. The residuals  are shown at the
bottom of the panel. Bottom panels: Likelihood distributions of
physical quantities derived from our fit to the observed SED: fraction of the
total IR luminosity contributed by dust in the diffuse ISM
(fμ); total effective
V-band absorption optical depth of dust
(
are shown at the
bottom of the panel. Bottom panels: Likelihood distributions of
physical quantities derived from our fit to the observed SED: fraction of the
total IR luminosity contributed by dust in the diffuse ISM
(fμ); total effective
V-band absorption optical depth of dust
( ); fraction of the total
V-band absorption optical depth of the dust contributed by the
diffuse ISM (μ); effective V-band absorption
optical depth of dust in the ambient ISM (
); fraction of the total
V-band absorption optical depth of the dust contributed by the
diffuse ISM (μ); effective V-band absorption
optical depth of dust in the ambient ISM ( );
specific star formation rate (ψS); stellar mass
(M∗) and dust mass
(Md); total dust IR luminosity
(
);
specific star formation rate (ψS); stellar mass
(M∗) and dust mass
(Md); total dust IR luminosity
( ); global
contributions by PAHs (
); global
contributions by PAHs ( ), the hot mid-IR
continuum (
), the hot mid-IR
continuum ( ) and warm dust to
(
) and warm dust to
( ); temperature of warm
dust in stellar birth clouds (
); temperature of warm
dust in stellar birth clouds ( ); contribution by
cold dust to
); contribution by
cold dust to  (
( ), and temperature of
cold dust in the diffuse ISM (
), and temperature of
cold dust in the diffuse ISM ( ).
).
Current usage metrics show cumulative count of Article Views (full-text article views including HTML views, PDF and ePub downloads, according to the available data) and Abstracts Views on Vision4Press platform.
Data correspond to usage on the plateform after 2015. The current usage metrics is available 48-96 hours after online publication and is updated daily on week days.
Initial download of the metrics may take a while.