Fig. 8
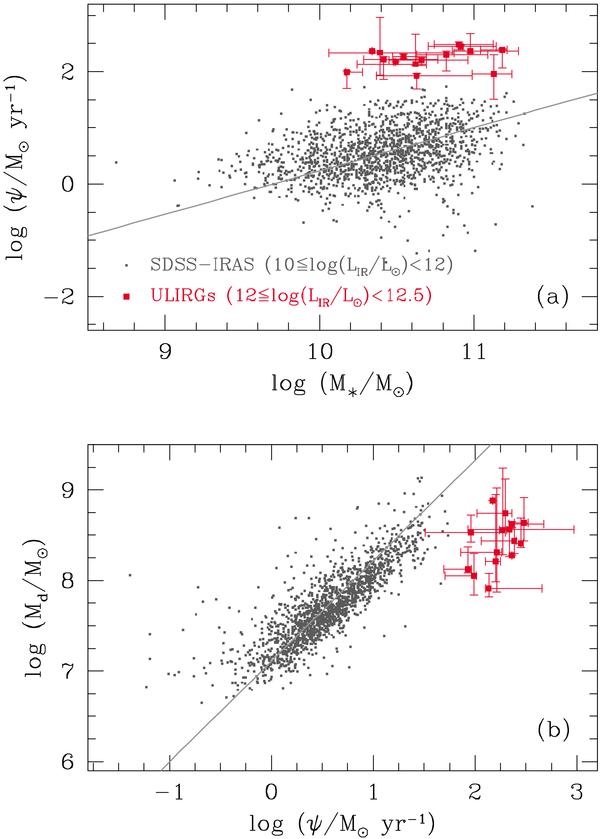
Median-likelihood estimates of star formation rate averaged over the last
108 yrs ψ , plotted against stellar mass
M∗a) and dust mass
Mdb) for 15 of our ULIRGs with
 (red points),
and 1538 local star-forming galaxies of lower infrared luminosities
(
(red points),
and 1538 local star-forming galaxies of lower infrared luminosities
( ) selected from
the SDSS-IRAS sample of da Cunha et al. 2010
(grey points). The errors bars correspond to the 16th–84th percentile range of the
parameter likelihood distributions. The light grey lines show the fit to the SDSS
points: a) best fit using a slope of 0.77 as found in Elbaz et al. (2007):
log (ψ) = −7.467 + 0.77log (M∗);
b) log (Md) = 7.107 + 1.11log (ψ),
as found by da Cunha et al. (2010).
) selected from
the SDSS-IRAS sample of da Cunha et al. 2010
(grey points). The errors bars correspond to the 16th–84th percentile range of the
parameter likelihood distributions. The light grey lines show the fit to the SDSS
points: a) best fit using a slope of 0.77 as found in Elbaz et al. (2007):
log (ψ) = −7.467 + 0.77log (M∗);
b) log (Md) = 7.107 + 1.11log (ψ),
as found by da Cunha et al. (2010).
Current usage metrics show cumulative count of Article Views (full-text article views including HTML views, PDF and ePub downloads, according to the available data) and Abstracts Views on Vision4Press platform.
Data correspond to usage on the plateform after 2015. The current usage metrics is available 48-96 hours after online publication and is updated daily on week days.
Initial download of the metrics may take a while.