Free Access
Fig. 1
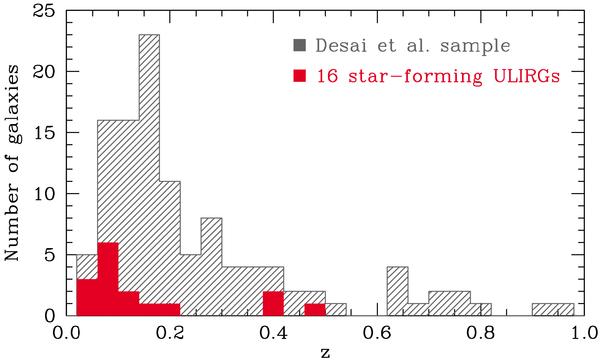
Redshift distribution of the 16 star-forming ULIRGs used in this study (red histogram). For comparison, the grey histogram shows the redshift distribution of the primary sample of 107 local ULIRGs of Desai et al. (2007).
Current usage metrics show cumulative count of Article Views (full-text article views including HTML views, PDF and ePub downloads, according to the available data) and Abstracts Views on Vision4Press platform.
Data correspond to usage on the plateform after 2015. The current usage metrics is available 48-96 hours after online publication and is updated daily on week days.
Initial download of the metrics may take a while.