Fig. 3
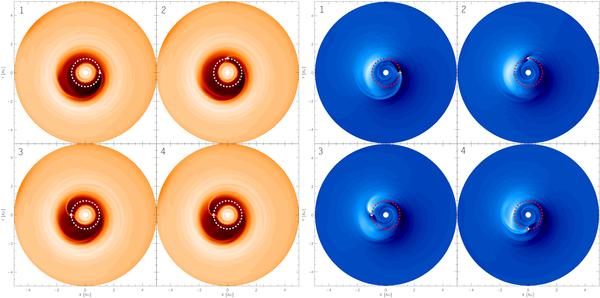
Surface density (left four figures, orange colors in the range of 0.2−250 g/cm2) and the radial velocity component of the orbital velocity in the disk plane (right four figures, blue colors in the range of −10.86 − +10.96 kms-1) distributions of the disks gaseous material taken from four different azimuthal positions of the planet’s 2000th orbit. In our model the total disk mass is 0.05 M⊙, the planet mass is 8 MJ, while the stellar mass is 1 M⊙. The planetary orbit is shown with a white and red dashed circle in the density and velocity plots. The gap (in dark) and the elliptic shape of its outer rim is clearly visible in the surface density distribution. In the vicinity of the gap the disk material shows a strong deviation from the circular Keplerian rotation, see the white clumps in the radial velocity component distribution.
Current usage metrics show cumulative count of Article Views (full-text article views including HTML views, PDF and ePub downloads, according to the available data) and Abstracts Views on Vision4Press platform.
Data correspond to usage on the plateform after 2015. The current usage metrics is available 48-96 hours after online publication and is updated daily on week days.
Initial download of the metrics may take a while.