Fig. 6
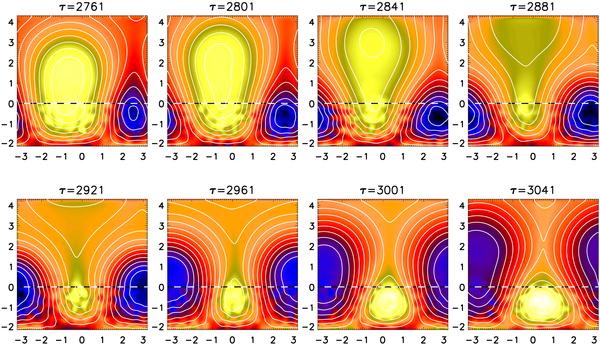
Time series of the formation of a plasmoid ejection. Contours of ⟨ Ax ⟩ x are shown together with a color-scale representation of ⟨ Bx ⟩ x; dark blue stands for negative and red for positive values. The contours of ⟨ Ax ⟩ x correspond to field lines of ⟨ B ⟩ x in the yz plane. The dotted horizontal lines show the location of the surface at z = 0.
Current usage metrics show cumulative count of Article Views (full-text article views including HTML views, PDF and ePub downloads, according to the available data) and Abstracts Views on Vision4Press platform.
Data correspond to usage on the plateform after 2015. The current usage metrics is available 48-96 hours after online publication and is updated daily on week days.
Initial download of the metrics may take a while.