Free Access
Fig. 9
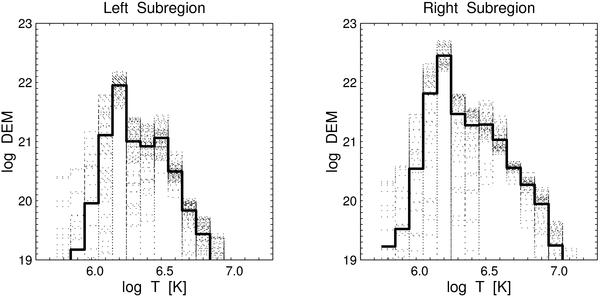
Results of the DEM reconstruction for the AR10923. The heavy solid lines indicate the optimal median DEM solutions; dotted histograms are the solutions of different Monte Carlo statistical realizations. The DEM is in units of [cm-5K-1].
Current usage metrics show cumulative count of Article Views (full-text article views including HTML views, PDF and ePub downloads, according to the available data) and Abstracts Views on Vision4Press platform.
Data correspond to usage on the plateform after 2015. The current usage metrics is available 48-96 hours after online publication and is updated daily on week days.
Initial download of the metrics may take a while.