Fig. 7
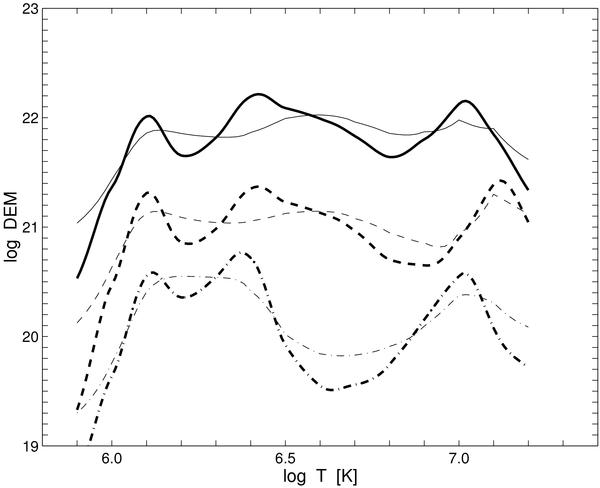
Example of DEM temperature profiles reconstructed with the BIM (thick curves) for the three SPIRIT/CORONAS-F line spectra ARs and the comparison with the corresponding results (thin curves) of Shestov et al. (2010): NOAA 9742, 28.12.2001 at 21:21 UT (solid lines); NOAA 9906, 20.04.2002 at 19:24 UT (dashed lines); NOAA 0223, 27.12.2002 at 09:06 UT (dash-dot lines). The DEM is in arbitrary units.
Current usage metrics show cumulative count of Article Views (full-text article views including HTML views, PDF and ePub downloads, according to the available data) and Abstracts Views on Vision4Press platform.
Data correspond to usage on the plateform after 2015. The current usage metrics is available 48-96 hours after online publication and is updated daily on week days.
Initial download of the metrics may take a while.