Fig. 4
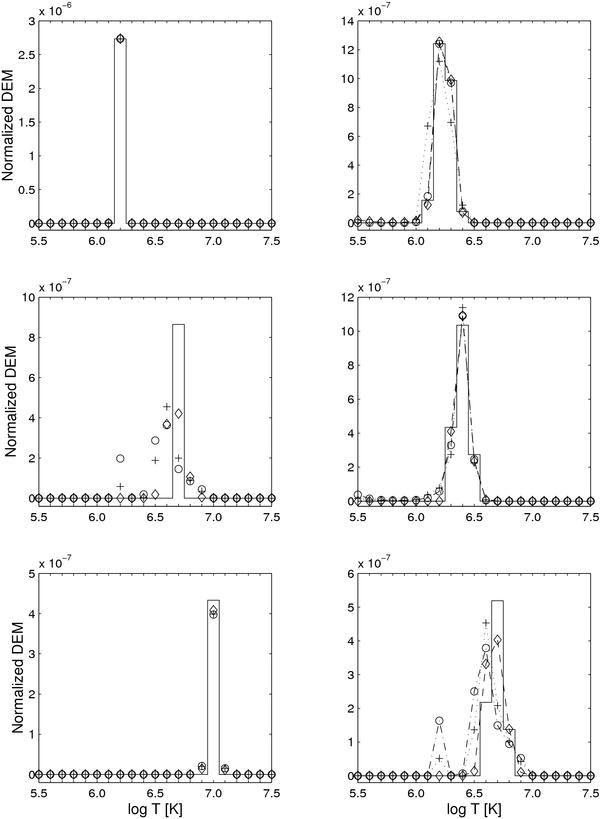
Forward modeling tests for DEM reconstruction with XRT channels. In the left column, the fits of single-temperature component DEMs are shown centered at log T = 6.2, 6.7, 7.0 and with the width Δlog T = 0.1. In the right column, the fittings for several multi-temperature DEMs are given. The model DEMs (solid lines) are compared with the reconstructed ones for three groups of XRT channels: the diamonds (left column) and diamonds with dashed line (right column) indicate the solutions for the nine XRT filters with standard calibration; the pluses and pluses with dotted line represent the five XRT filters with standard calibration; the circles and circles with dash-dot line stand for the five XRT filters with calibration of Reale et al. (2009). The DEMs are given as normalized distributions ρ(T) in units of [K-1].
Current usage metrics show cumulative count of Article Views (full-text article views including HTML views, PDF and ePub downloads, according to the available data) and Abstracts Views on Vision4Press platform.
Data correspond to usage on the plateform after 2015. The current usage metrics is available 48-96 hours after online publication and is updated daily on week days.
Initial download of the metrics may take a while.