Free Access
Fig. 3
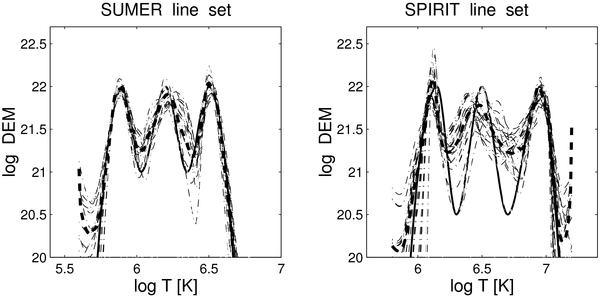
Stability tests of the BIM. The heavy solid line stands for the model DEMs; the dash-dot lines indicate the calculated distributions using the perturbed line fluxes; the heavy dashed line indicates the median fit. The y axis gives the logarithm of DEM in arbitrary units.
Current usage metrics show cumulative count of Article Views (full-text article views including HTML views, PDF and ePub downloads, according to the available data) and Abstracts Views on Vision4Press platform.
Data correspond to usage on the plateform after 2015. The current usage metrics is available 48-96 hours after online publication and is updated daily on week days.
Initial download of the metrics may take a while.