Fig. 2
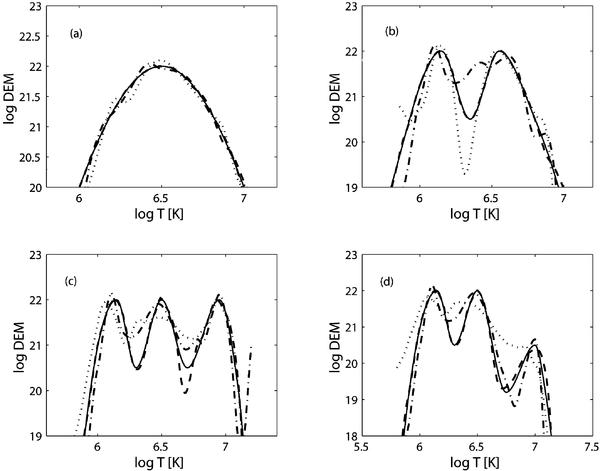
Results of the forward modeling tests. The model DEM distributions (solid lines) are compared with the reconstructed ones for three sets of spectral data: the SUMER line set (dashed lines), the SPIRIT line set (dash-dot lines), and the nine XRT filter channels (dotted lines). The y axis gives the logarithm of DEM in arbitrary units.
Current usage metrics show cumulative count of Article Views (full-text article views including HTML views, PDF and ePub downloads, according to the available data) and Abstracts Views on Vision4Press platform.
Data correspond to usage on the plateform after 2015. The current usage metrics is available 48-96 hours after online publication and is updated daily on week days.
Initial download of the metrics may take a while.