Fig. 10
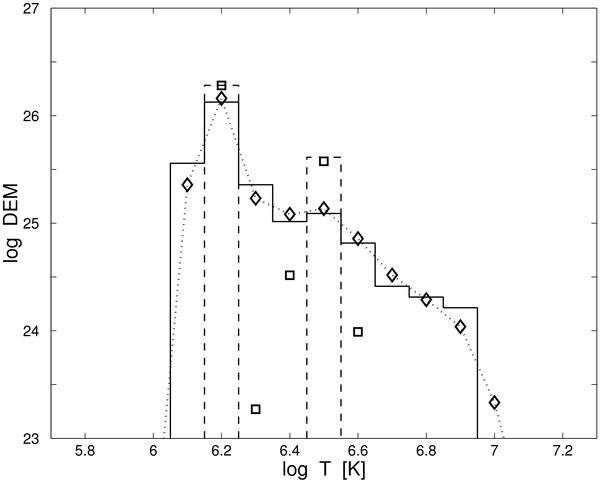
Results of the XRT forward modeling for two input DEM curves: multi-thermal DEM distribution (solid line histogram) and two-temperature DEM with isolated components at temperatures log T = 6.2 and 6.5 (dashed histogram). The diamonds with the dotted line indicate the reconstructed DEM curve for multi-thermal case; the squares are the DEM solution to the two-temperature model. The DEM is in arbitrary units.
Current usage metrics show cumulative count of Article Views (full-text article views including HTML views, PDF and ePub downloads, according to the available data) and Abstracts Views on Vision4Press platform.
Data correspond to usage on the plateform after 2015. The current usage metrics is available 48-96 hours after online publication and is updated daily on week days.
Initial download of the metrics may take a while.