Free Access
Fig. 2
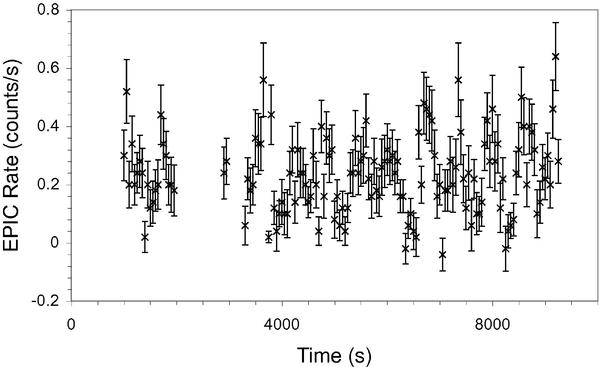
Combined (MOS1 MOS2) 0.2–10.0 keV EPIC background subtracted light curve binned at 50 s. For clarity, the time axis indicates the time since MJD 53642.034. The gaps in the light curve are a result of filtering out background flares.
Current usage metrics show cumulative count of Article Views (full-text article views including HTML views, PDF and ePub downloads, according to the available data) and Abstracts Views on Vision4Press platform.
Data correspond to usage on the plateform after 2015. The current usage metrics is available 48-96 hours after online publication and is updated daily on week days.
Initial download of the metrics may take a while.