Fig. 1
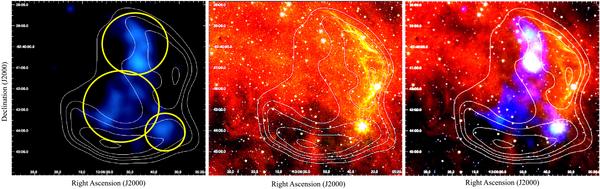
Left panel: XMM-Newton color image of the X-ray emission in the 0.3–10 keV energy range (in blue) of G304.6 + 0.1 with the radio contours (in white) at 843 MHz overlaid. The extraction regions used for the spectral analysis are also indicated as yellow circles. Central panel: IRAC three-channels composed image of G304.6 + 0.1 with the radio contours (in white) at 843 MHz overlaid. Right panel: composite color image of the radio, mid-infrared, and X-ray emissions of G304.6 + 0.1. All images are in equatorial coordinates J2000.
Current usage metrics show cumulative count of Article Views (full-text article views including HTML views, PDF and ePub downloads, according to the available data) and Abstracts Views on Vision4Press platform.
Data correspond to usage on the plateform after 2015. The current usage metrics is available 48-96 hours after online publication and is updated daily on week days.
Initial download of the metrics may take a while.