Fig. 9
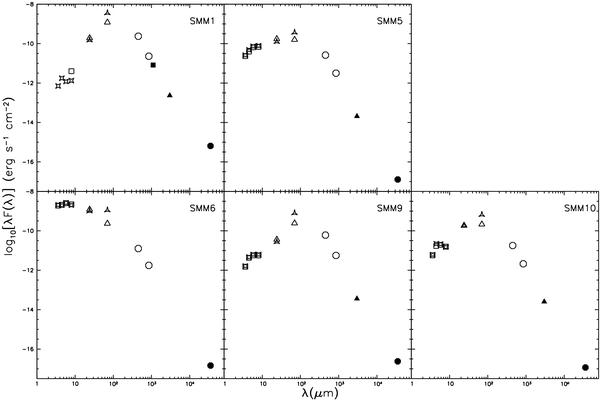
Spectral energy distribution diagrams for the sources exhibiting 70 μm emission. Empty squares and star-like squares are IRAC band 1 to 4 flux densities from Winston et al. (2007) and Harvey et al. (2007) respectively; empty triangles and star-like triangles are MIPS band 1 and 2 from Winston et al. (2007) and Harvey et al. (2007). Empty circles are submillimeter flux densities at 450 and 850 μm from Davis et al. (1999). Filled squares and triangles are 1.1 and 3 mm flux densities from Enoch et al. (2007) and Williams & Myers (2000). Filled circles are 3.5 cm flux densities from Eiroa et al. (2005). Note that the 70 μm flux of Harvey et al. (2007) is constantly higher by a factor ~ 2–3 compared to the one reported by Winston et al. (2007).
Current usage metrics show cumulative count of Article Views (full-text article views including HTML views, PDF and ePub downloads, according to the available data) and Abstracts Views on Vision4Press platform.
Data correspond to usage on the plateform after 2015. The current usage metrics is available 48-96 hours after online publication and is updated daily on week days.
Initial download of the metrics may take a while.