Fig. 10
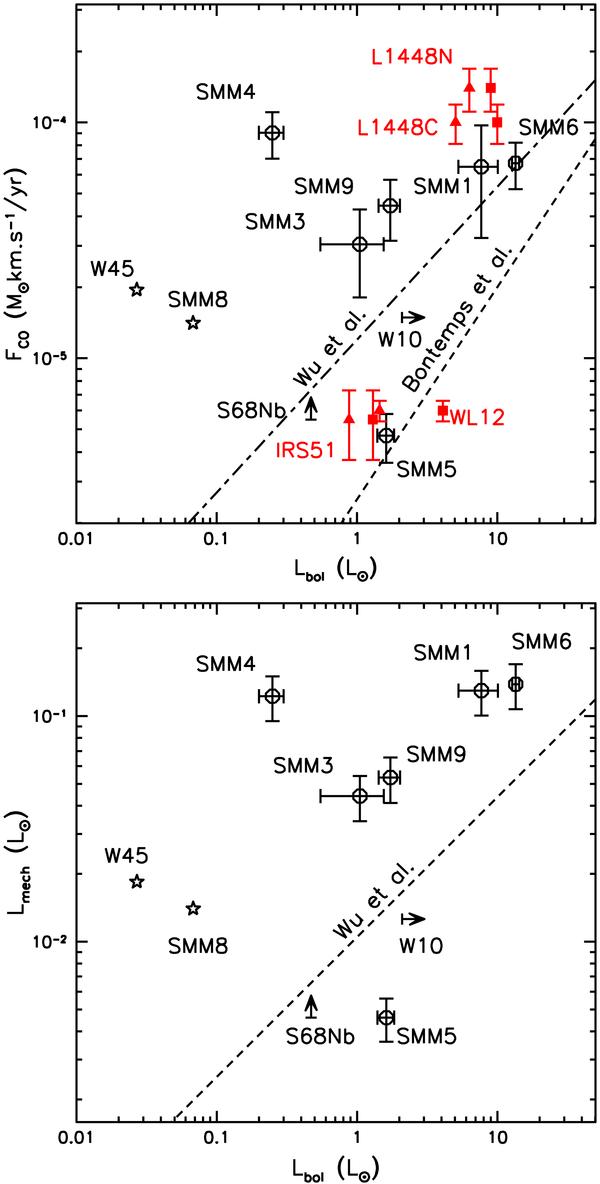
(Upper panel) Momentum flux vs bolometric luminosity. Open circles indicate sources from the current sample of Serpens, vertical errorbars correspond to values of the momentum flux for τ = 0 and 1, and horizontal errorbars to the differences in the derived bolometric luminosities for the different Spitzer fluxes in Winston et al. (2007) and Harvey. Arrows and asterisks mark Serpens sources that either FCO, Lbol, or both are uncertain. The dashed line shows the location of the Class I correlation of Bontemps et al. (1996), and the dot-dashed line the correlation of both low- and high-mass sources of Wu et al. (2004). Filled (red) squares correspond to test sources from the sample that Bontemps et al. (1996) used to control the influence of the new Spitzer derived (red triangles) Lbol to the correlation. (Lower panel) Outflow mechanical luminosity versus the bolometric luminosity for the sample of sources in Serpens; the Lmech − Lbol correlation for the sample of both low- and high- mass sources of Wu et al. (2004) is shown as a dashed line, running through the data points and separating Class 0 and Class I sources.
Current usage metrics show cumulative count of Article Views (full-text article views including HTML views, PDF and ePub downloads, according to the available data) and Abstracts Views on Vision4Press platform.
Data correspond to usage on the plateform after 2015. The current usage metrics is available 48-96 hours after online publication and is updated daily on week days.
Initial download of the metrics may take a while.