Fig. 1
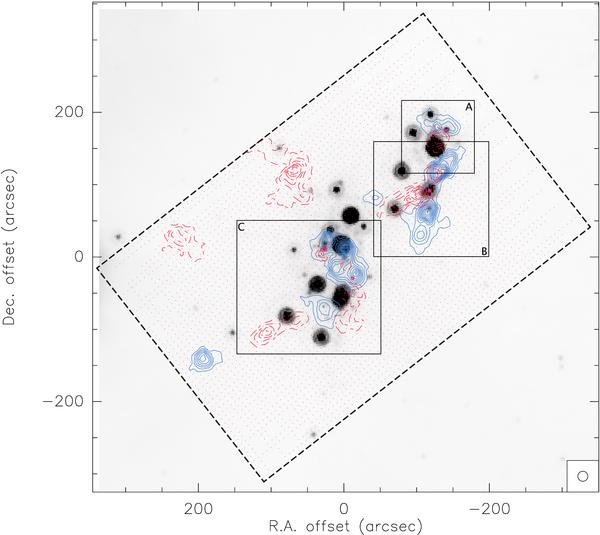
High-velocity CO J = 3 → 2 outflow map superimpsed on an MIPS band 1 (centered on 24 μm) image of the Serpens cloud core. Solid (blue) contours delineate blue-shifted gas (integrated over − 30 km s km s-1, while dashed (red) contours delineate red-shifted gas (integrated over 18 km s
 km s-1). The dashed rectangle indicates the extent of the mapped region, centered on
  ,
,  (J2000). Filled and dashed controus start at 0.8 K km s-1 with an 1 K km s-1 increment. HARP-B detector beam of ~ 14″ is represented as a circle in the lower right corner. The dashed rectangle delineates the observed area, and solid rectangles named A, B, C represent areas that are presented in magnification in Figs. 3, 5, and 7 respectively.
Current usage metrics show cumulative count of Article Views (full-text article views including HTML views, PDF and ePub downloads, according to the available data) and Abstracts Views on Vision4Press platform.
Data correspond to usage on the plateform after 2015. The current usage metrics is available 48-96 hours after online publication and is updated daily on week days.
Initial download of the metrics may take a while.