Fig. 8
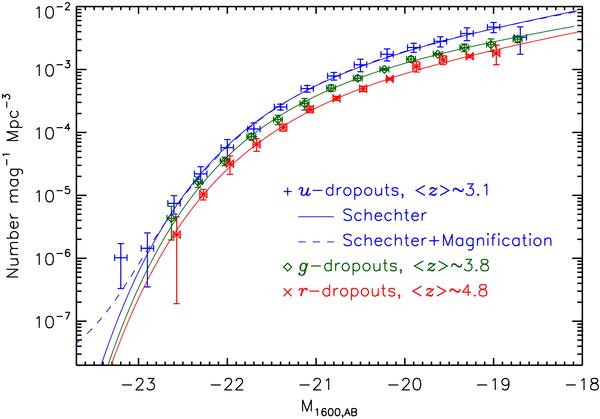
The LFs of LBGs in the CFHTLS-Deep fields. Data points and best-fitting Schechter functions are shown for the u(blue)-, g(green)-, and r(red)-dropouts. For legibility we applied a small offset on the x-axis values of the g-, and r- dropouts. The dashed blue curve shows the best fitting Schechter function for the u-dropouts after magnification effects have been included, as described in Sect. 4.1.1.
Current usage metrics show cumulative count of Article Views (full-text article views including HTML views, PDF and ePub downloads, according to the available data) and Abstracts Views on Vision4Press platform.
Data correspond to usage on the plateform after 2015. The current usage metrics is available 48-96 hours after online publication and is updated daily on week days.
Initial download of the metrics may take a while.