Fig. 5
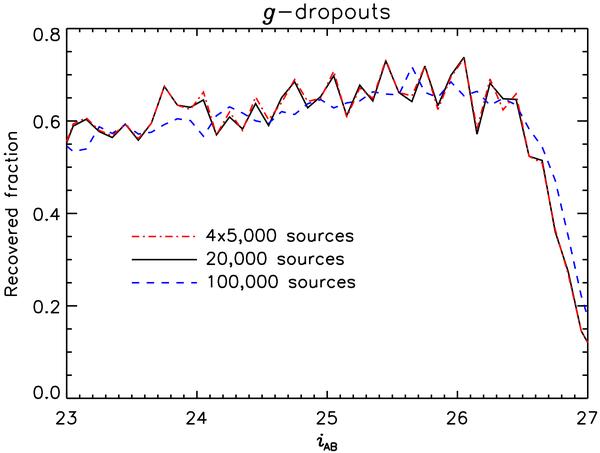
The recovered fraction of injected sources that also satisfy the g-dropout criteria, as a function of i-band magnitude, for 1 redshift step. Three curves are given for different amounts of injected sources, to see whether, and how, the presence of these sources influences the photometry of the analysis.
Current usage metrics show cumulative count of Article Views (full-text article views including HTML views, PDF and ePub downloads, according to the available data) and Abstracts Views on Vision4Press platform.
Data correspond to usage on the plateform after 2015. The current usage metrics is available 48-96 hours after online publication and is updated daily on week days.
Initial download of the metrics may take a while.