Fig. 4
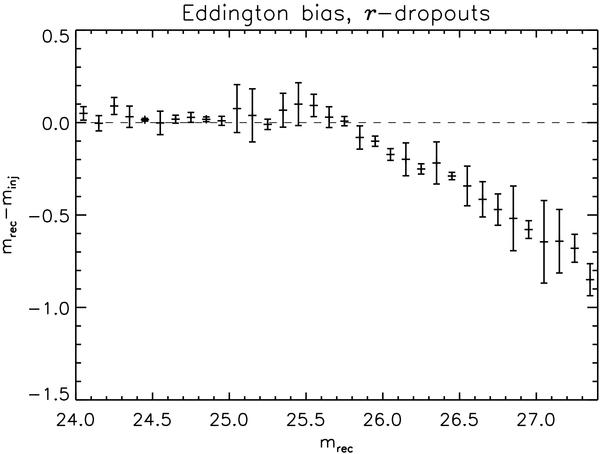
The difference between recovered and injected source magnitudes as a function of recovered magnitude for the r-dropouts. Similar trends appear in the other dropout samples. The error bars reflect the scatter from the four fields. A similar effect as shown around mrec = 25.3, namely an increase of mrec − minj, is found by Bouwens et al. (2006, Fig.19), where observations were used rather than simulations.
Current usage metrics show cumulative count of Article Views (full-text article views including HTML views, PDF and ePub downloads, according to the available data) and Abstracts Views on Vision4Press platform.
Data correspond to usage on the plateform after 2015. The current usage metrics is available 48-96 hours after online publication and is updated daily on week days.
Initial download of the metrics may take a while.