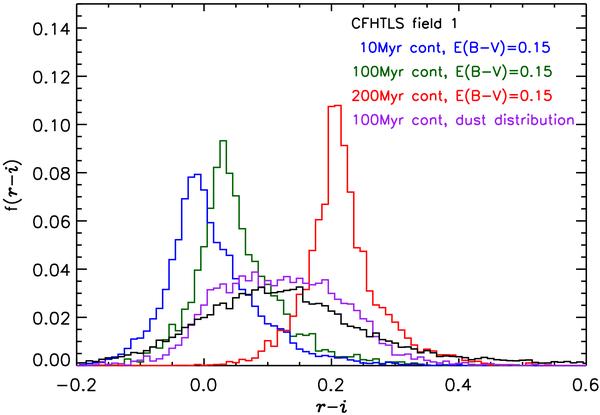
Fig. 3

The distribution of UV-continuum slopes for the u-dropouts as measured by the r − i colour from the CFHT data (black) compared with the outcomes from simulations. The colour is measured in a part of the spectrum without strong features, redward of 1600 Å. Both an older template and a higher amount of dust result in a redder UV colour. The amount of dust we need to add therefore depends on the age of the base template. For the u-dropouts we find that a uniform distribution of dust with 0.1 < E(B − V) < 0.4 gives a good fit to the data, when the template is 100 Myr old with a constant amount of star formation (purple).
Current usage metrics show cumulative count of Article Views (full-text article views including HTML views, PDF and ePub downloads, according to the available data) and Abstracts Views on Vision4Press platform.
Data correspond to usage on the plateform after 2015. The current usage metrics is available 48-96 hours after online publication and is updated daily on week days.
Initial download of the metrics may take a while.


