Fig. 2
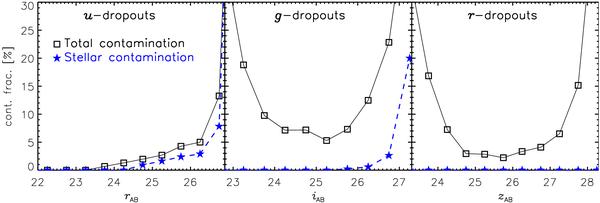
Contamination fractions of stars and low-z galaxies in the dropout samples. Blue ⋆ -symbols connected by a dashed line show the stellar contamination fraction based on a galactic model. Black squares connected by the solid line show the total contamination fraction from Hildebrandt et al. (2009).
Current usage metrics show cumulative count of Article Views (full-text article views including HTML views, PDF and ePub downloads, according to the available data) and Abstracts Views on Vision4Press platform.
Data correspond to usage on the plateform after 2015. The current usage metrics is available 48-96 hours after online publication and is updated daily on week days.
Initial download of the metrics may take a while.