Fig. 10
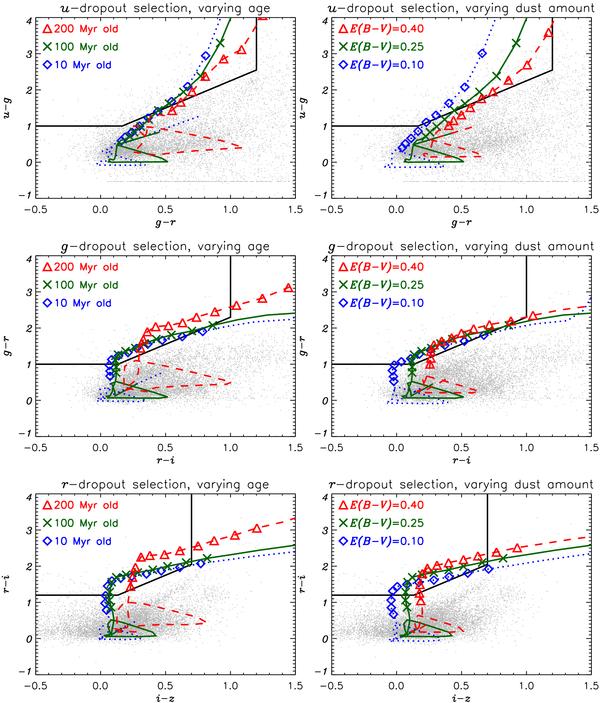
The grey points represent the colours of 10 000 objects in field 1 of the CFHTLS Deep. The black boxes are defined by Eqs. (1)–(3) and are used to select u-(top panels), g-(middle panels), and r-(bottom panels) dropouts. The coloured tracks represent the colours of a template galaxy as a function of z. They are evaluated at intervals of Δz = 0.1. The symbols mark redshifts from 2.5 to 3.5, from 3.2 to 4.2 and from 4.2 to 5.2 for u-, g-, and r-dropouts respectively. The green curve with × -symbols represents a reference model, a 100 Myr old continuously star-forming template with a dust attenuation of E(B − V) = 0.25. In the left panels we consider redder (bluer) templates by increasing (decreasing) the template age, see the red (blue) curves and the △ (◇)-symbols. In the right panels we consider redder (bluer) templates by increasing (decreasing) the amount of dust in the template, see the red (blue) curves and the △ (◇)-symbols. Note that we use a distribution of dust in our fiducial analysis (see Sect. 3.1).
Current usage metrics show cumulative count of Article Views (full-text article views including HTML views, PDF and ePub downloads, according to the available data) and Abstracts Views on Vision4Press platform.
Data correspond to usage on the plateform after 2015. The current usage metrics is available 48-96 hours after online publication and is updated daily on week days.
Initial download of the metrics may take a while.