Fig. 9
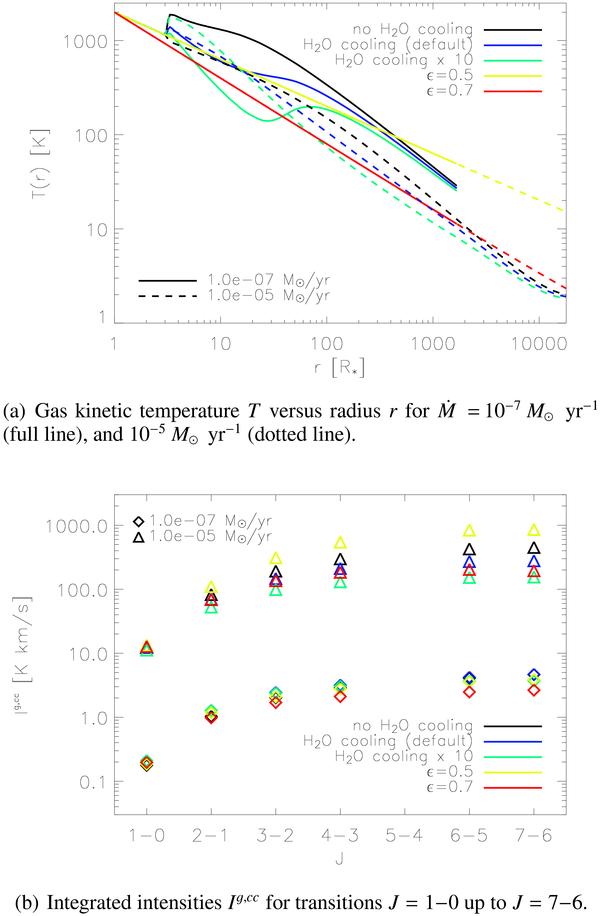
Gas kinetic temperatures a) and integrated intensities b) for different Ṁinput-values and different cooling mechanisms. The colour coding in both panels is as follows: black was used for omission of H2O-cooling, blue for inclusion of H2O-cooling, green for inclusion of H2O-cooling ten times stronger than by default, yellow for a temperature power law, as in Eq. (10), with ϵ = 0.5, and red for ϵ = 0.7. In the lower panel, the different values of the input-mass-loss rate are indicated with diamonds and triangles for Ṁ = 10-7 M⊙ yr-1 and 10-5 M⊙ yr-1, respectively. See discussion in Sect. 3.5.2.
Current usage metrics show cumulative count of Article Views (full-text article views including HTML views, PDF and ePub downloads, according to the available data) and Abstracts Views on Vision4Press platform.
Data correspond to usage on the plateform after 2015. The current usage metrics is available 48-96 hours after online publication and is updated daily on week days.
Initial download of the metrics may take a while.