Fig. 8
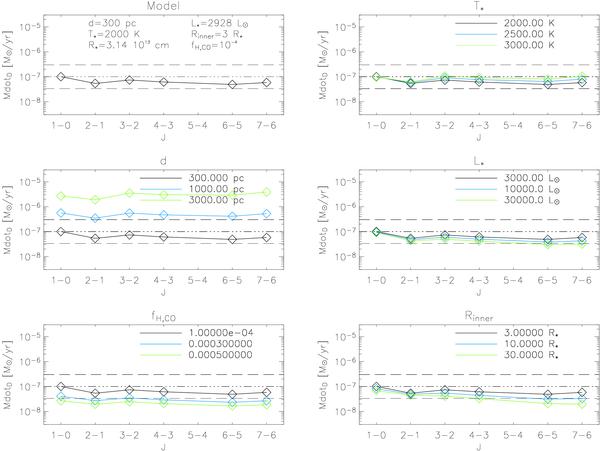
Sensitivity check of the used formalism for five parameters: d, fH,CO, T ⋆, L ⋆ (R ⋆), and Rinner. The upper left panel gives the estimates based on the input parameters of the model and the output values of the integrated intensities Ig,cc. The grid values for the different parameters and the colour coding are specified in the legend of every panel. The dash-dotted line in all panels marks the model’s input-Ṁ, 10-7 M⊙ yr-1, the dashed lines mark a factor three difference w.r.t. this value.
Current usage metrics show cumulative count of Article Views (full-text article views including HTML views, PDF and ePub downloads, according to the available data) and Abstracts Views on Vision4Press platform.
Data correspond to usage on the plateform after 2015. The current usage metrics is available 48-96 hours after online publication and is updated daily on week days.
Initial download of the metrics may take a while.