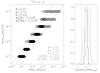
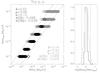
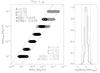
Fig. 6
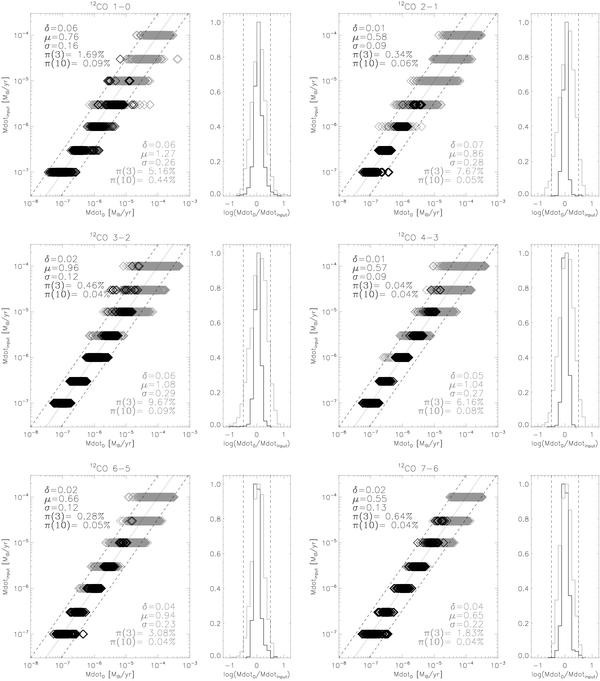
Comparison between the input value Ṁinput and ṀD resulting from using Eq. (9) for different rotational CO line transitions. Estimates for the non-saturated regime are plotted in black, for the saturated regime in grey. The dotted line represents equality of the input and estimated mass-loss rates, the dashed lines show a factor 3 difference w.r.t. this relation. The listed δ, σ, and μ are the mean, the standard deviations, and the maximum absolute values of log (ṀD/Ṁinput), respectively. π(3) and π(10) show the percentage of grid models that produce values of ṀD deviating more than a factor 3, resp. 10, from Ṁinput. The histogram on the right of each panel shows the peak-normalised distribution of log (ṀD/Ṁinput). The vertical dashed lines in these histograms again show a factor three difference between ṀD and Ṁinput. The black and grey histograms represent estimates for the non-saturated, and saturated regimes, respectively.
Current usage metrics show cumulative count of Article Views (full-text article views including HTML views, PDF and ePub downloads, according to the available data) and Abstracts Views on Vision4Press platform.
Data correspond to usage on the plateform after 2015. The current usage metrics is available 48-96 hours after online publication and is updated daily on week days.
Initial download of the metrics may take a while.