Fig. 5
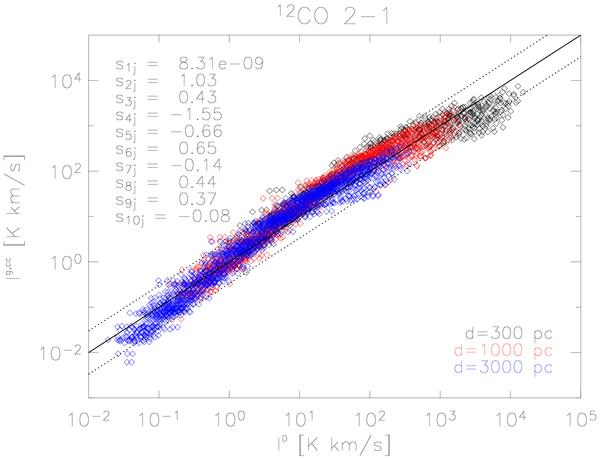
The continuum corrected integrated intensities Ig,cc predicted with GASTRoNOoM are compared to the values ID calculated with Eq. (8). Values for the exponents si,J in Eq. (8) are specified in the upper left corner. The full line represents equality of Ig,cc and ID, the dotted lines show a factor 3 difference w.r.t. this relation. For all three distance values assumed in the model grid, the estimates are plotted in a different color: black for d = 300 pc, red for d = 1000 pc, and blue for d = 3000 pc. See Sect. 3.4 for further details.
Current usage metrics show cumulative count of Article Views (full-text article views including HTML views, PDF and ePub downloads, according to the available data) and Abstracts Views on Vision4Press platform.
Data correspond to usage on the plateform after 2015. The current usage metrics is available 48-96 hours after online publication and is updated daily on week days.
Initial download of the metrics may take a while.