Fig. 4
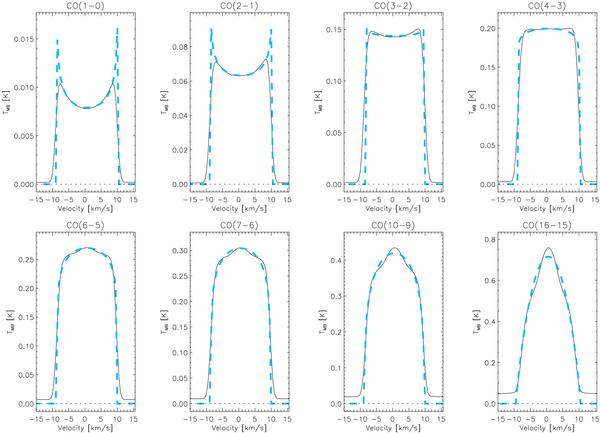
Line profile predictions for T ⋆ = 2000 K, L ⋆ = 3000 L⊙, d = 300 pc, fH,CO = 1 × 10⁻⁴, 12C/13C = 10, Rinner = 3 R ⋆ , Ṁ = 1 × 10⁻⁷ M⊙ yr-1, v∞ = 10 km s-1 for a beam width of 10′′. The soft-parabola fit is plotted in dashed grey/light blue lines. For the high-J excitation lines one can see both the stellar and dust continuum and the acceleration zone (the narrow peaks around the line centres).
Current usage metrics show cumulative count of Article Views (full-text article views including HTML views, PDF and ePub downloads, according to the available data) and Abstracts Views on Vision4Press platform.
Data correspond to usage on the plateform after 2015. The current usage metrics is available 48-96 hours after online publication and is updated daily on week days.
Initial download of the metrics may take a while.