Fig. 14
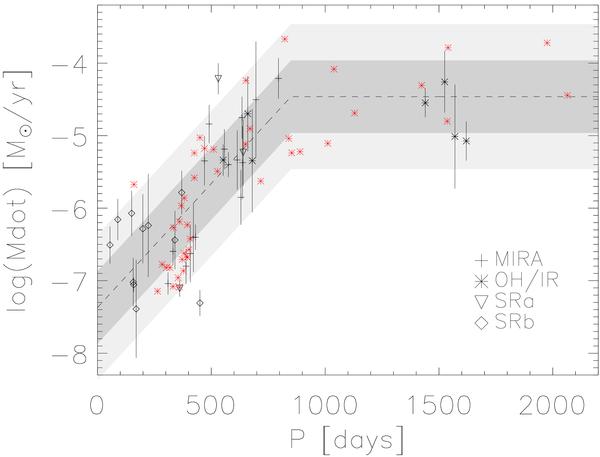
Mean estimates for Ṁ versus period of pulsation for the AGB stars in the sample are plotted in black. Different pulsational types are indicated with different plotting symbols: + for Miras, ∗ for OH/IR stars, ∇ for SRa and ⋄ for SRb type stars. The red ∗ OH/IR data points were obtained from He & Chen (2001,priv. comm.). A linear relation fits the Miras, OH/IR stars and semi-regular variables in our sample with periods shorter than 850 days. Ṁ levels off to a constant value of 2.6 × 10⁻⁵ M⊙ yr-1 for longer periods. The darker shaded region represents a factor three spread around this fit, the paler grey region represents a spread of a factor 10. See Sect. 5.1.3 for further details.
Current usage metrics show cumulative count of Article Views (full-text article views including HTML views, PDF and ePub downloads, according to the available data) and Abstracts Views on Vision4Press platform.
Data correspond to usage on the plateform after 2015. The current usage metrics is available 48-96 hours after online publication and is updated daily on week days.
Initial download of the metrics may take a while.