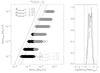
Fig. 10
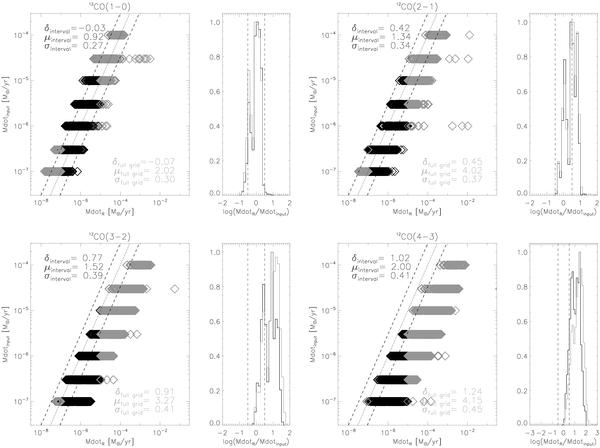
Ṁinput versus ṀR calculated from the grid also used to construct Fig. 6 and Eq. (6). The dotted line indicates where the quantities are equal, the dashed lines show a factor three difference w.r.t. this relation. The listed δ,μ, and σ are, respectively, the mean values, the standard deviations, and the maximum absolute values of log (ṀR/Ṁinput). We specify these quantities for the full grid (plotted in grey), and for the grid points inside the interval [10-7;10-5] M⊙ yr-1 (plotted in black). The histogram in each panel shows the peak-normalised distribution of log (ṀR/Ṁinput).
Current usage metrics show cumulative count of Article Views (full-text article views including HTML views, PDF and ePub downloads, according to the available data) and Abstracts Views on Vision4Press platform.
Data correspond to usage on the plateform after 2015. The current usage metrics is available 48-96 hours after online publication and is updated daily on week days.
Initial download of the metrics may take a while.