Fig. 31
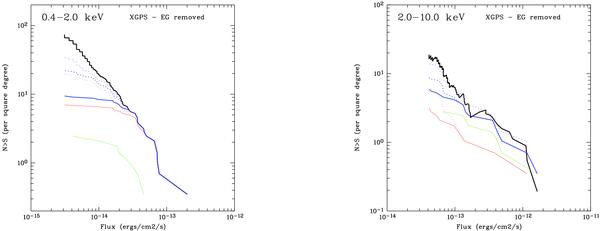
Soft and hard XGPS log N(> S) − log S curves after subtracting the ASCA extragalactic contribution (EG) (thick black lines). The contribution of different categories of source are also shown as follows: identified stars (red, see text); accreting candidates (green); and all identified (blue). The dashed lines show the result of also including matches with USNO-B1.0 and 2MASS which have probabilities higher than 90% to the assumed stellar (red) and total (blue) identifications. The upper magenta dashed line shows the sum of all spectroscopically identified sources added to sources with an individual probability >50% to be positively associated with a USNO-B1.0 or 2MASS entry.
Current usage metrics show cumulative count of Article Views (full-text article views including HTML views, PDF and ePub downloads, according to the available data) and Abstracts Views on Vision4Press platform.
Data correspond to usage on the plateform after 2015. The current usage metrics is available 48-96 hours after online publication and is updated daily on week days.
Initial download of the metrics may take a while.