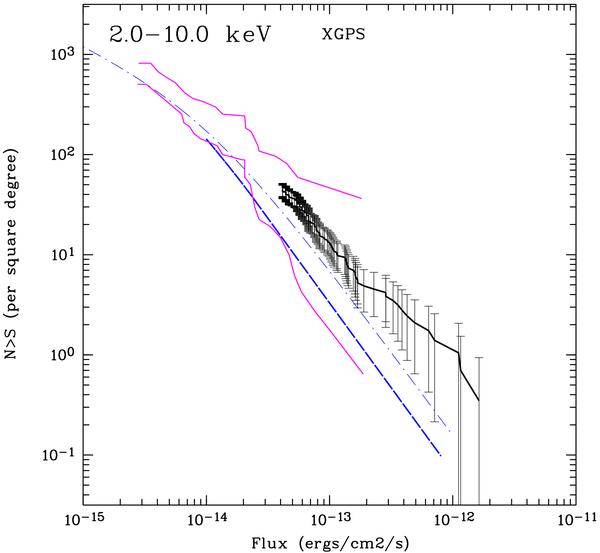
Fig. 30

The log N(> S) − log S curve of XGPS sources in the hard band. Error bars represent the one sigma counting statistics. At faint fluxes, the 90% confidence region of the log N(> S) − log S curve of Ebisawa et al. (2001) is shown in magenta. The dash-dotted blue curve represents the expected extragalactic contribution assuming a mean NH of 9.0 × 1022 cm-2. Thin line: after Campana et al. (2001). Thick line: after Mateos et al. (2008).
Current usage metrics show cumulative count of Article Views (full-text article views including HTML views, PDF and ePub downloads, according to the available data) and Abstracts Views on Vision4Press platform.
Data correspond to usage on the plateform after 2015. The current usage metrics is available 48-96 hours after online publication and is updated daily on week days.
Initial download of the metrics may take a while.


