Fig. 29
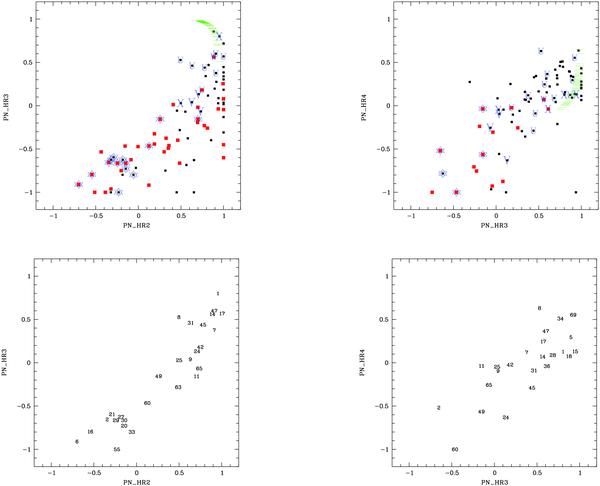
The distribution of the XGPS/2XMM sources in the EPIC pn hardness ratio diagrams. For clarity, we show only those sources with hardness ratio errors less than 0.3. Upper panel: Larger red squares; sources having an optical or infrared counterpart with matching probability above 90%. Small black squares; the remaining XGPS sources. The overplotted characters (in blue) show the sources observed at the telescope. Stars - identified active coronae; V − cataclysmic variables; X − high-mass and low-mass X-ray binary candidates; W – Wolf-Rayet; U − sources unidentified at the telescope. The green strips illustrate the locus occupied by extragalactic sources, computed assuming a power-law spectrum of photon index 1.7 and the total Galactic absorption on the line of sight. Lower panel: corresponding id numbers of the XGPS sources observed at the telescope.
Current usage metrics show cumulative count of Article Views (full-text article views including HTML views, PDF and ePub downloads, according to the available data) and Abstracts Views on Vision4Press platform.
Data correspond to usage on the plateform after 2015. The current usage metrics is available 48-96 hours after online publication and is updated daily on week days.
Initial download of the metrics may take a while.