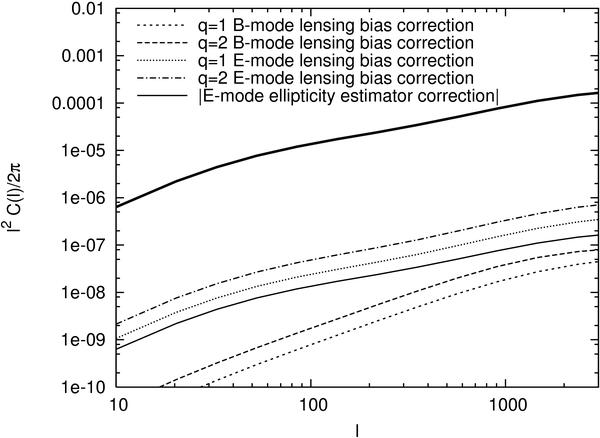
Fig. 2

Linear order shear power spectrum (thick
solid line; Eq. (12)) and
 lensing bias and
ellipticity estimator corrections. The short dashed (dashed) lines show the lensing
bias corrections to the B-mode shear power spectrum (Eq. (61)) assuming q = 1
(q = 2). The dotted (dashed-dotted) lines show the lensing bias
corrections to the E-mode shear power spectrum (Eq. (60)) assuming q = 1 (q = 2).
The fine solid line illustrates the magnitude of the correction arising from the
conversion between ellipticity and reduced shear Eq. (45) for the e ellipticity with
⟨ e(s)2 ⟩ 1 / 2 = 0.6. This correction is negative and its
normalization depends on the distribution of source galaxies (see Sect. 3.3 for details). This figure uses the same
cosmology and source redshifts as Fig. 1.
Current usage metrics show cumulative count of Article Views (full-text article views including HTML views, PDF and ePub downloads, according to the available data) and Abstracts Views on Vision4Press platform.
Data correspond to usage on the plateform after 2015. The current usage metrics is available 48-96 hours after online publication and is updated daily on week days.
Initial download of the metrics may take a while.


