Fig. 4
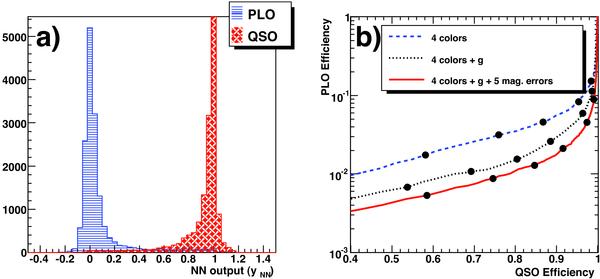
a) ANN output for objects classified as PLO in the SDSS photometric catalog, i.e. background objects, (blue dotted histogram) and for objects spectroscopically classified as QSO (red slashed histogram) in the control samples, using 10 variables: 4 colors, g magnitude, and errors in the five (u,g,r,i and z) magnitudes. b) PLO efficiency as a function of the QSO efficiency for three ANN configurations. Blue dashed line: 4 colors (u − g,g − r,r − i,i − z). Black dotted line: 4 colors + g magnitude. Red solid line: 4 colors + g magnitude + errors in the five (u,g,r,i and z) magnitudes. The curves are obtained by varying the cut value,  for the two distributions of Fig. 4a. Efficiency is defined as the ratio of the number of objects with a ANN output greater than to the number of objects in the sample. The dots correspond, from left to right, to equal to, respectively, 0.2, 0.5, 0.8, 0.9, 0.95, and 0.98.
Current usage metrics show cumulative count of Article Views (full-text article views including HTML views, PDF and ePub downloads, according to the available data) and Abstracts Views on Vision4Press platform.
Data correspond to usage on the plateform after 2015. The current usage metrics is available 48-96 hours after online publication and is updated daily on week days.
Initial download of the metrics may take a while.