Fig. 42
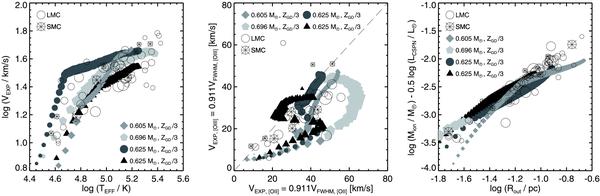
Various correlations for the same objects and model sequences as in Fig. 41. The meaning of the symbols (PNe and models) is the same as in Fig. 41. The triangles refer always to the new 0.625 M⊙ sequence introduced in the right panel of Fig. 41. All sequences are only plotted until maximum stellar temperature is reached, in order to avoid some confusion, and also because they become too faint. Left panel: nebular expansion from the [O iii] 5007 Å line width vs. stellar temperature for Magellanic Cloud PNe compared with the hydrodynamical model sequences. The observed stellar temperatures are from the extensive photoionisation modelling by Dopita & Meatheringham (1991a,b). Middle panel: correlation between velocities derived from [O ii] 3726 Å and [O iii] 5007 Å according to Dopita et al. (1988) and the hydrodynamical models. Right panel: reduced nebular mass vs. radius relations for Magellanic Clouds PNe and our hydrodynamical models. Data again from Dopita & Meatheringham (1991a,b).
Current usage metrics show cumulative count of Article Views (full-text article views including HTML views, PDF and ePub downloads, according to the available data) and Abstracts Views on Vision4Press platform.
Data correspond to usage on the plateform after 2015. The current usage metrics is available 48-96 hours after online publication and is updated daily on week days.
Initial download of the metrics may take a while.