Fig. 41
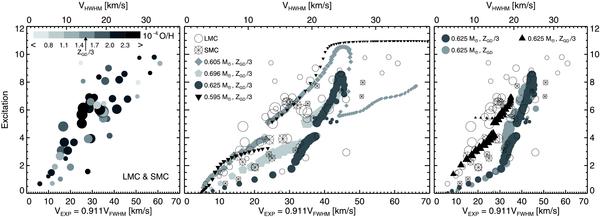
Nebular excitations, E, vs. 5007 Å velocities, Vexp = 0.911VFWHM, for Magellanic Clouds PNe (Dopita et al. 1985, 1988) and our hydrodynamical simulations. Observed objects and models are broken down into the same M(5007) brightness classes, as indicated by the symbol sizes: the larger the symbol, the brighter the object or model, respectively. The approximate brightness range covers 4 mag. The top abscissa is labelled in terms of VHWHM for easier comparison with previous figures. Left panel: LMC and SMC PNe additionally broken down into classes of different oxygen abundances (from Dopita & Meatheringham 1991a,b), visualised by various grey shades. The darkest grey corresponds to ≥ ZGD/2, the lightest grey to ≤ ZGD/5. The vertical arrow indicates the oxygen abundance corresponding to ZGD/3. Middle panel: comparison of observations with the model sequences as indicated. The gaps seen in the model sequences are artefacts due to the definition of E combined with the lower oxygen abundance of the Clouds (Eqs. (5), see text there). Note that the spacings of the models within a sequence does by no means reflect the speed of evolution. Right panel: a 0.625 M⊙ model sequence (α = 2, Z = ZGD/3) with different initial parameters, Ṁagb = 0.5 × 10⁻⁴ M⊙ yr-1 and Vagb = 7.5 km s-1 (filled triangles), compared with the 0.625 M⊙ZGD/3 sequence from the middle panel and a metal richer (Z = ZGD) 0.625 M⊙ sequence (see legend).
Current usage metrics show cumulative count of Article Views (full-text article views including HTML views, PDF and ePub downloads, according to the available data) and Abstracts Views on Vision4Press platform.
Data correspond to usage on the plateform after 2015. The current usage metrics is available 48-96 hours after online publication and is updated daily on week days.
Initial download of the metrics may take a while.