Fig. 32
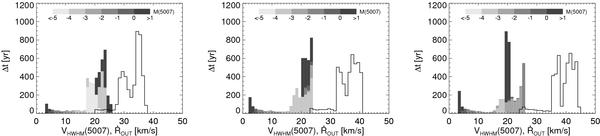
Times Δt spent by the models within the velocity intervals ΔVHWHM = 1 km s-1 and  km s-1. The VHWHM bins are broken down into M(5007) intervals as indicated by the different shades. The ΔṘout histogram serves only for comparison and is not broken down into magnitude intervals. Shown are the three 0.625 M⊙ sequences with Z = ZGD (left), Z = ZGD/3 (middle), and Z = ZGD/10 (right) whose velocity and brightness evolution are also seen in the Figs. 26 and 31. The maximum post-AGB age considered is 5000 years. The Δt for the faintest magnitudes are lower limits only because of this time limit.
Current usage metrics show cumulative count of Article Views (full-text article views including HTML views, PDF and ePub downloads, according to the available data) and Abstracts Views on Vision4Press platform.
Data correspond to usage on the plateform after 2015. The current usage metrics is available 48-96 hours after online publication and is updated daily on week days.
Initial download of the metrics may take a while.