Fig. 30
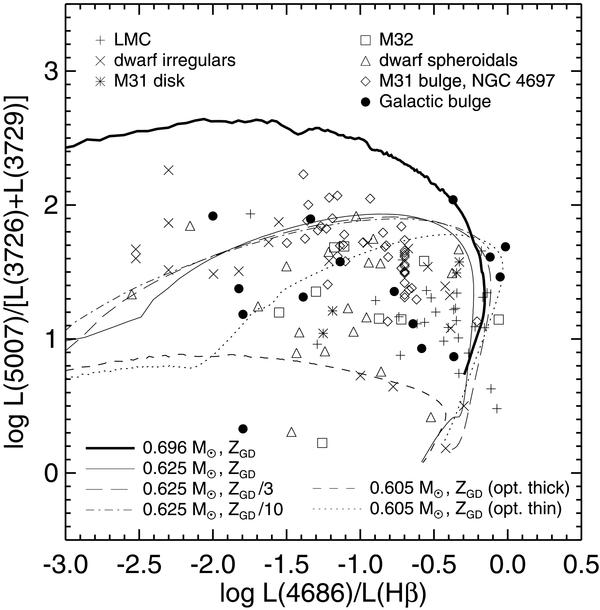
The ratios L(5007)/ [L(3726) + L(3729)] are shown against L(4686)/L(Hβ). The predictions from a selection of our simulations (the two 0.605 M⊙ sequences are from Paper IV) is compared with Local Group data taken from Richer (2006, references therein and priv. comm.). The Galactic bulge data are from Stasińska et al. (1998). Shown are only objects with well-determined line strengths and which are not fainter than two magnitudes below the [O iii] PNLF cut-off. Evolution proceeds from left to right and then down because of recombination. In order to be consistent with the data, the tracks are truncated at two magnitudes below the PNLF cut-off. The kinks seen in two sequences are due to the optically thick/thin transition.
Current usage metrics show cumulative count of Article Views (full-text article views including HTML views, PDF and ePub downloads, according to the available data) and Abstracts Views on Vision4Press platform.
Data correspond to usage on the plateform after 2015. The current usage metrics is available 48-96 hours after online publication and is updated daily on week days.
Initial download of the metrics may take a while.