Fig. 25
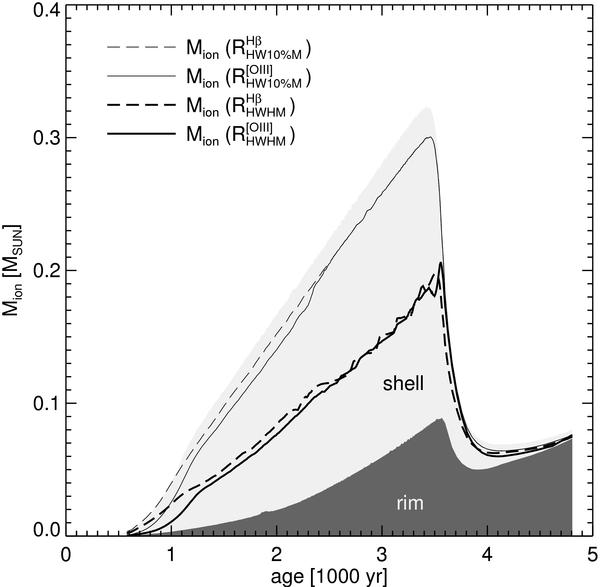
Evolution of nebular mass fractions vs. time for the 0.625 M⊙ sequence from Fig. 24 with Z = ZGD. Shown are the total (ionised) mass enclosed by the outer nebular boundary, Mion(Rout), with the different contributions of the shell (light grey) and rim (dark grey) indicated. The different lines indicate mass fractions contained within certain distances R from the star for which the real gas velocities reach distinct limits:  contains all mass shells with
  (thick dashed line), and
  is the corresponding mass value for [O iii] 5007 Å (thick solid line). HWHM refers to the total, volume integrated line profile. The thin lines (solid and dashed) indicate the masses enclosed by the radii RHW10%M where the (real) gas velocity v corresponds to the half width of the 10% intensity level of the integrated line profile, i.e. v = VHW10%M.
Current usage metrics show cumulative count of Article Views (full-text article views including HTML views, PDF and ePub downloads, according to the available data) and Abstracts Views on Vision4Press platform.
Data correspond to usage on the plateform after 2015. The current usage metrics is available 48-96 hours after online publication and is updated daily on week days.
Initial download of the metrics may take a while.