Fig. 23
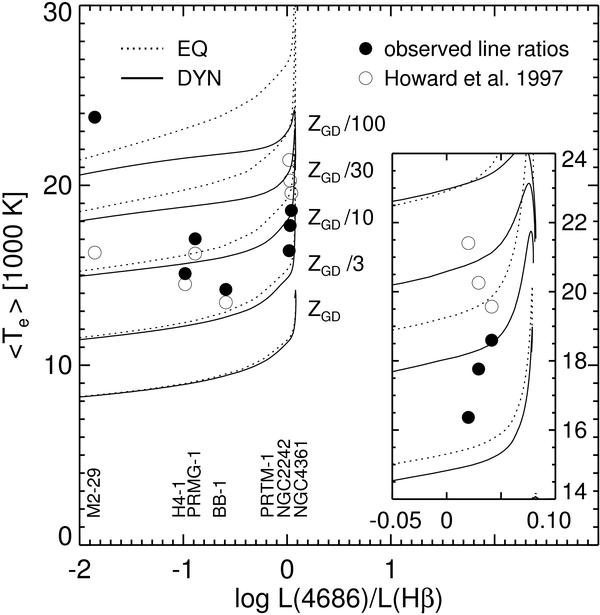
Mean nebular [O iii] electron temperatures vs. nebular line ratio L(4686)/L(Hβ) for the dynamical α = 3 sequences from Fig. 18 (dotted in thermal equilibrium). Again, the sequences are only plotted until maximum stellar temperature in order to avoid confusion. The circles give the corresponding positions of the Halo PNe: filled circles are based on the observed [O iii] lines, open circles are results of detailed analyses using photoionisation models (Howard et al. 1997). The inset renders an enlarged view of the region around L(4686)/L(Hβ) ≃ 1.
Current usage metrics show cumulative count of Article Views (full-text article views including HTML views, PDF and ePub downloads, according to the available data) and Abstracts Views on Vision4Press platform.
Data correspond to usage on the plateform after 2015. The current usage metrics is available 48-96 hours after online publication and is updated daily on week days.
Initial download of the metrics may take a while.