Fig. 21
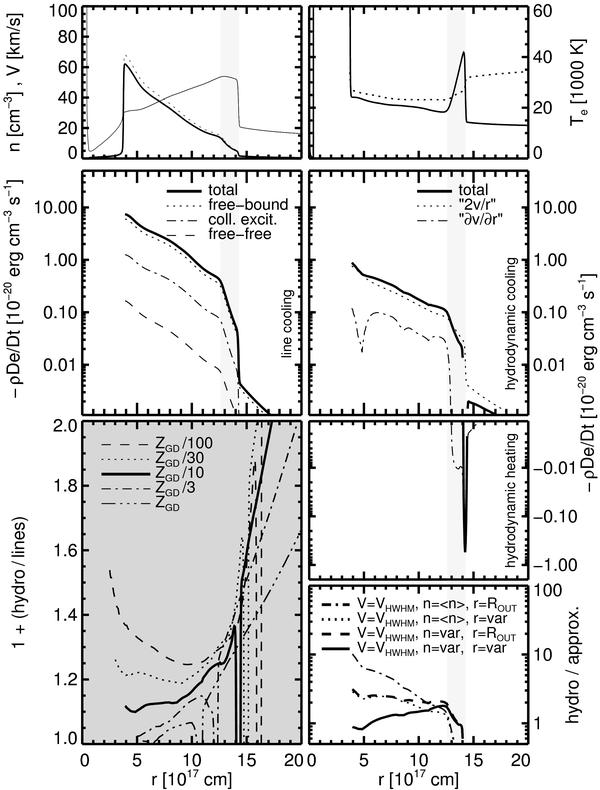
The effect of dynamical/expansion cooling as described by the source/sink term p(∇·v) for the ZGD/10, α = 3 model shown in Fig. 7 where the central star has gained its maximum effective temperature (see the track in Fig. 3). Top row: model structure with particle densities and flow velocities (left, ions = thick solid, electrons = dotted, velocity = thin solid) and temperatures (right, dynamical = solid, equilibrium = dotted). The shadowed vertical strip indicates the thickness of the outer shock region. Second row: different contributions of line cooling (left) and dynamical cooling (right), as indicated in the legends, both based on the equilibrium temperature. The right panel with the two hydrodynamical terms (∂v/∂r and 2v/r) is “mirrored” at the horizontal axis in order to show also heating due to compressions if ∂v/∂r becomes negative (shock front and halo/upstream region). Note that no cooling terms are plotted for the hot bubble, i.e. inside the contact discontinuity at ≃3.5 × 1017 cm. Bottom left (shadowed): total cooling (line + hydro) to line cooling, taken from the middle panels (thick solid) and for models with the same evolutionary time but with other metallicities (see legend). Note the different radius ranges covered by the models: the inner boundaries are set by the respective contact discontinuities, and the vertical “double” lines mark the outer shock regions where heating by compression prevails. Bottom right: ratio between adiabatic cooling using Eq. (4), with the model data displayed in the top panels (hydro) and using various approximations (approx), always based on the equilibrium electron temperature: mean of total particle density of 40 cm-3 and fixed outer radius Rout = 1.4 × 1018 cm (dash-dotted), the (same) mean density but a variable radius (dotted), variable density and fixed outer radius (dashed), and finally variable density and radial coordinate (solid). In all cases, the model velocity VHWHM = 40 km s-1 is used.
Current usage metrics show cumulative count of Article Views (full-text article views including HTML views, PDF and ePub downloads, according to the available data) and Abstracts Views on Vision4Press platform.
Data correspond to usage on the plateform after 2015. The current usage metrics is available 48-96 hours after online publication and is updated daily on week days.
Initial download of the metrics may take a while.