Fig. 19
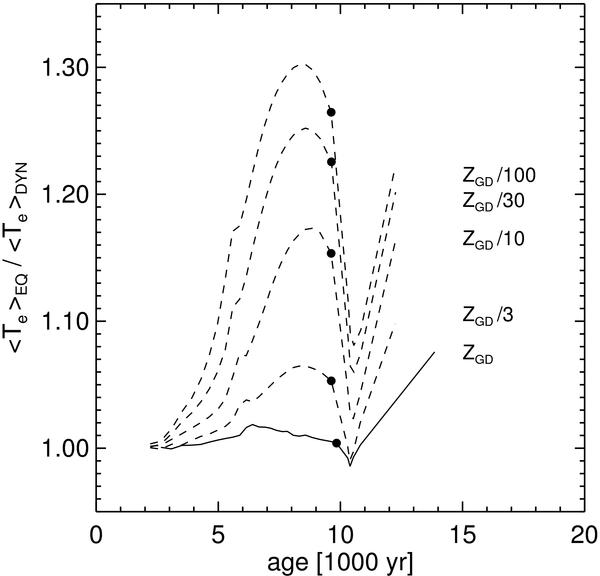
Ratios between electron temperatures of equilibrium (eq) and dynamical (dyn) α = 3 models with different metal contents are plotted versus post-AGB age. The filled dot on each curve indicates the position of maximum stellar temperature. The sharp local minima of the temperature ratios occur during nebular recombination while the central star fades rapidly (cf. Figs. 3 and 8). See text for details.
Current usage metrics show cumulative count of Article Views (full-text article views including HTML views, PDF and ePub downloads, according to the available data) and Abstracts Views on Vision4Press platform.
Data correspond to usage on the plateform after 2015. The current usage metrics is available 48-96 hours after online publication and is updated daily on week days.
Initial download of the metrics may take a while.