Fig. 14
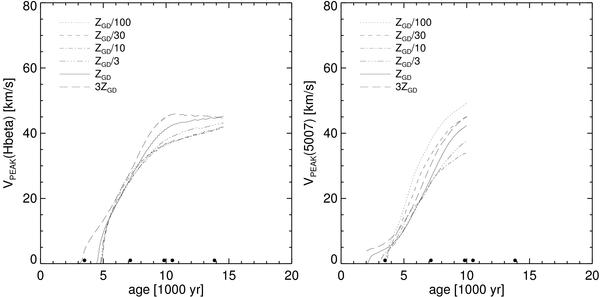
Expansion properties as derived from the line peak separation of spatially resolved line profiles for the same six α = 3 sequences shown in Figs. 12 and 13 vs. the post-AGB age, for Hβ (left) and [O iii] 5007 Å (right). The line profiles are simulated using a central numerical aperture of 1 × 1016 cm (or 0″̣67 at a distance of 1 kpc). At low ages, the profiles are still singly peaked, and thus Vpeak = 0. The [O iii] profiles are only plotted up to model ages of about 10 000 yr because beyond this age the profiles develop a complex structure due to recombination. The five black dots along the abscissas correspond again to the snapshots depicted in Figs. 5−9.
Current usage metrics show cumulative count of Article Views (full-text article views including HTML views, PDF and ePub downloads, according to the available data) and Abstracts Views on Vision4Press platform.
Data correspond to usage on the plateform after 2015. The current usage metrics is available 48-96 hours after online publication and is updated daily on week days.
Initial download of the metrics may take a while.