Fig. 13
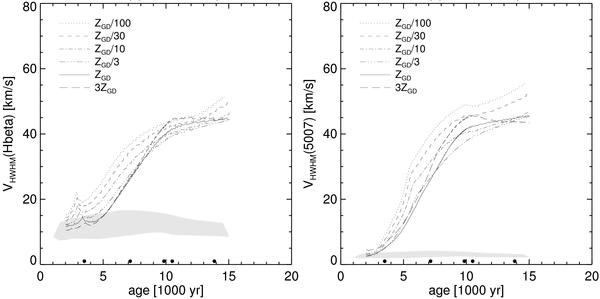
Expansion properties as derived from the half width at half maximum (HWHM) of the spatially integrated line profiles for the same six α = 3 sequences shown in Fig. 12 vs. the post-AGB age, for Hβ (left) and [O iii] 5007 Å (right). Again, the five black dots along the abscissas refer to the snapshots depicted in Figs. 5−9. The shadowed areas indicate the thermal Doppler broadening, computed by means of the mean electron temperatures (see next section). The lower boundary refers to the models with the highest metallicity, 3 ZGD, the upper boundary to those with the lowest metallicity, ZGD/100.
Current usage metrics show cumulative count of Article Views (full-text article views including HTML views, PDF and ePub downloads, according to the available data) and Abstracts Views on Vision4Press platform.
Data correspond to usage on the plateform after 2015. The current usage metrics is available 48-96 hours after online publication and is updated daily on week days.
Initial download of the metrics may take a while.