Fig. 3
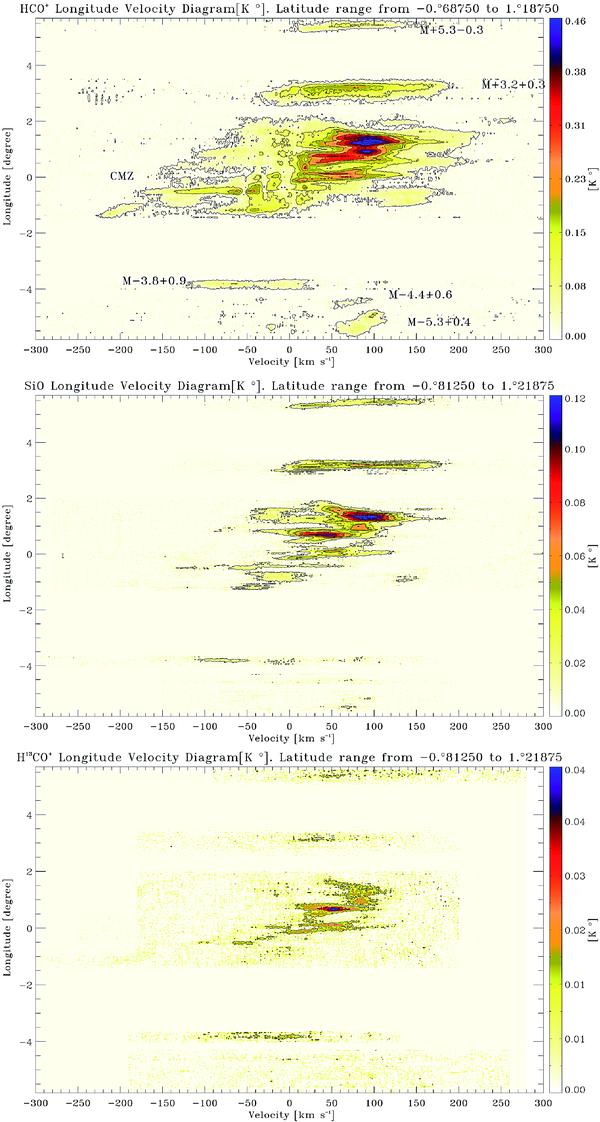
Top: longitude-velocity diagram of HCO+ emission from
the CMZ and PMZ covering the whole survey in the latitude range between
 to
to  . The contour levels start at 0.021 K
(3σ), and increase in steps of 0.058 K (8σ).
Middle: longitude-velocity diagram of SiO emission from the CMZ
and PMZ covering the whole survey in the latitude range between
. The contour levels start at 0.021 K
(3σ), and increase in steps of 0.058 K (8σ).
Middle: longitude-velocity diagram of SiO emission from the CMZ
and PMZ covering the whole survey in the latitude range between
 to
to  . The contour levels start at 0.01 K
(3σ), and increase in steps of 0.018 K (5σ).
Bottom: longitude-velocity diagram of
H13CO+ emission from the CMZ and PMZ covering the whole
survey in the latitude range between to . The contour levels start at 0.009 K
(3σ), and increase in steps of 0.016 K (5σ).
. The contour levels start at 0.01 K
(3σ), and increase in steps of 0.018 K (5σ).
Bottom: longitude-velocity diagram of
H13CO+ emission from the CMZ and PMZ covering the whole
survey in the latitude range between to . The contour levels start at 0.009 K
(3σ), and increase in steps of 0.016 K (5σ).
Current usage metrics show cumulative count of Article Views (full-text article views including HTML views, PDF and ePub downloads, according to the available data) and Abstracts Views on Vision4Press platform.
Data correspond to usage on the plateform after 2015. The current usage metrics is available 48-96 hours after online publication and is updated daily on week days.
Initial download of the metrics may take a while.