Fig. 10
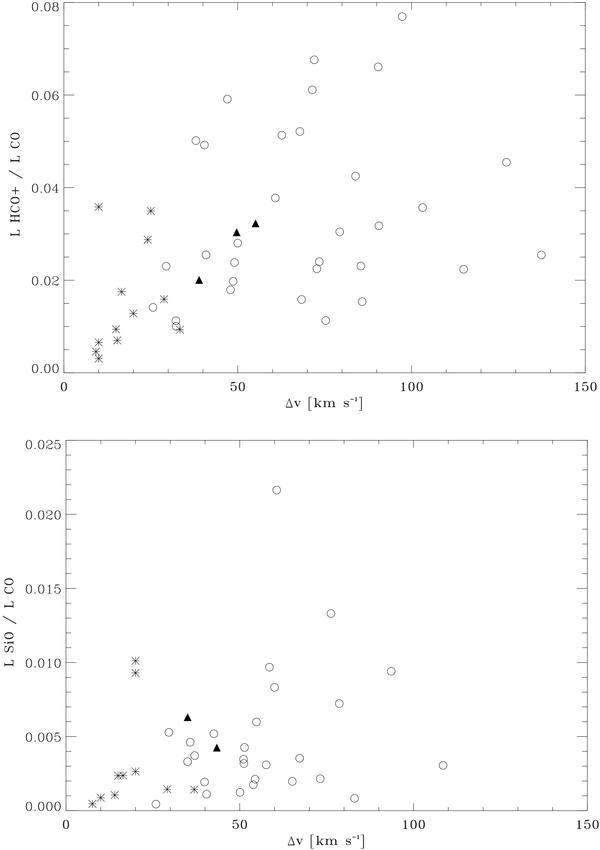
Relationship between the luminosity ratio HCO+ to CO (top) and the HCO+ velocity width, and the luminosity ratio SiO to CO (bottom) and the SiO velocity width for each molecular cloud of the survey. Open circles denote Galactic center clouds, an asterisk the disk clouds, and filled triangles are clouds that probably are in an intermediate region, influenced by a bar, and that present large linewidth, probably due the strong Galactic center tidal forces in this region. There is a cloud (number 35 in SiO) with a large linewidth (~35 kms-1) in the bottom plot. This cloud is also not considered in our analysis owing the poor fit (see Fig. E.8).
Current usage metrics show cumulative count of Article Views (full-text article views including HTML views, PDF and ePub downloads, according to the available data) and Abstracts Views on Vision4Press platform.
Data correspond to usage on the plateform after 2015. The current usage metrics is available 48-96 hours after online publication and is updated daily on week days.
Initial download of the metrics may take a while.